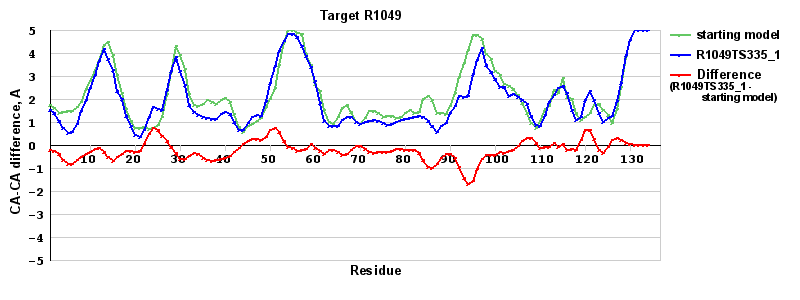
| Refined vs starting models comparison. Model: R1049TS335_1 |
|
|
|
|
|
| Green line: distance between the aligned CA atoms in the starting model and the experimental structure in the LGA sequence-independent superposition under the 4A distance cutoff (see LGA description). |
| Blue line: distance between the corresponding CA atoms in a refined model and the experimental structure in the LGA sequence-independent superposition under the 4A distance cutoff. |
| Red line = (blue line) - (green thick line): difference between the corresponding Refined Model-Target and Starting Model-Target CA-CA distances (see above). Negative values show regions where the reifned model has better fit to the target than the starting model, i.e. areas of potential improvement. |
|
The plot above is generated applying the moving average method with window of 3 positions. |
|

